OPSI-WebGUI 4.3.48: A New Foundation
 Jeena John
 Release
 August 12, 2026

With the 4.3.48 release, OPSI-WebGUI has been rebuilt from the ground up. The new version uses Nuxt 4, TypeScript, and Tailwind CSS, replacing the previous Nuxt 2 and BootstrapVue implementation. This provides a faster, leaner, and easier-to-maintain codebase while making future development and new features easier.
The new OPSI-WebGUI was already previewed at OPSIconf 2026 in Mainz on April 14–15. During the workshop “Administration with OPSI-configed & OPSI-WebGUI: Best Practices”, attendees got a first look at the new interface and its long-awaited dashboard. Watch the preview here.
This blog post explains what has changed for existing users, shows how OPSI-WebGUI works alongside opsi-configed, and guides you through the basic WebGUI workflow.
New to OPSI-WebGUI? Start here
OPSI-WebGUI is the web interface for administering an OPSI environment.
It runs as an addon inside opsiconfd and can be accessed through a modern web browser at:
https://<opsi-server>:4447/addons/webgui/app
OPSI-WebGUI requires no client-side installation and can be used on desktops, laptops, tablets, or smartphones. It supports light and dark themes and is available in English, German, and French. It uses the same permission model as OPSI and respects the server’s configured roles and restrictions.
You can log in with your regular OPSI credentials. If SAML SSO is configured, an SSO option is available on the login page.
What’s new in OPSI-WebGUI?
A new dashboard
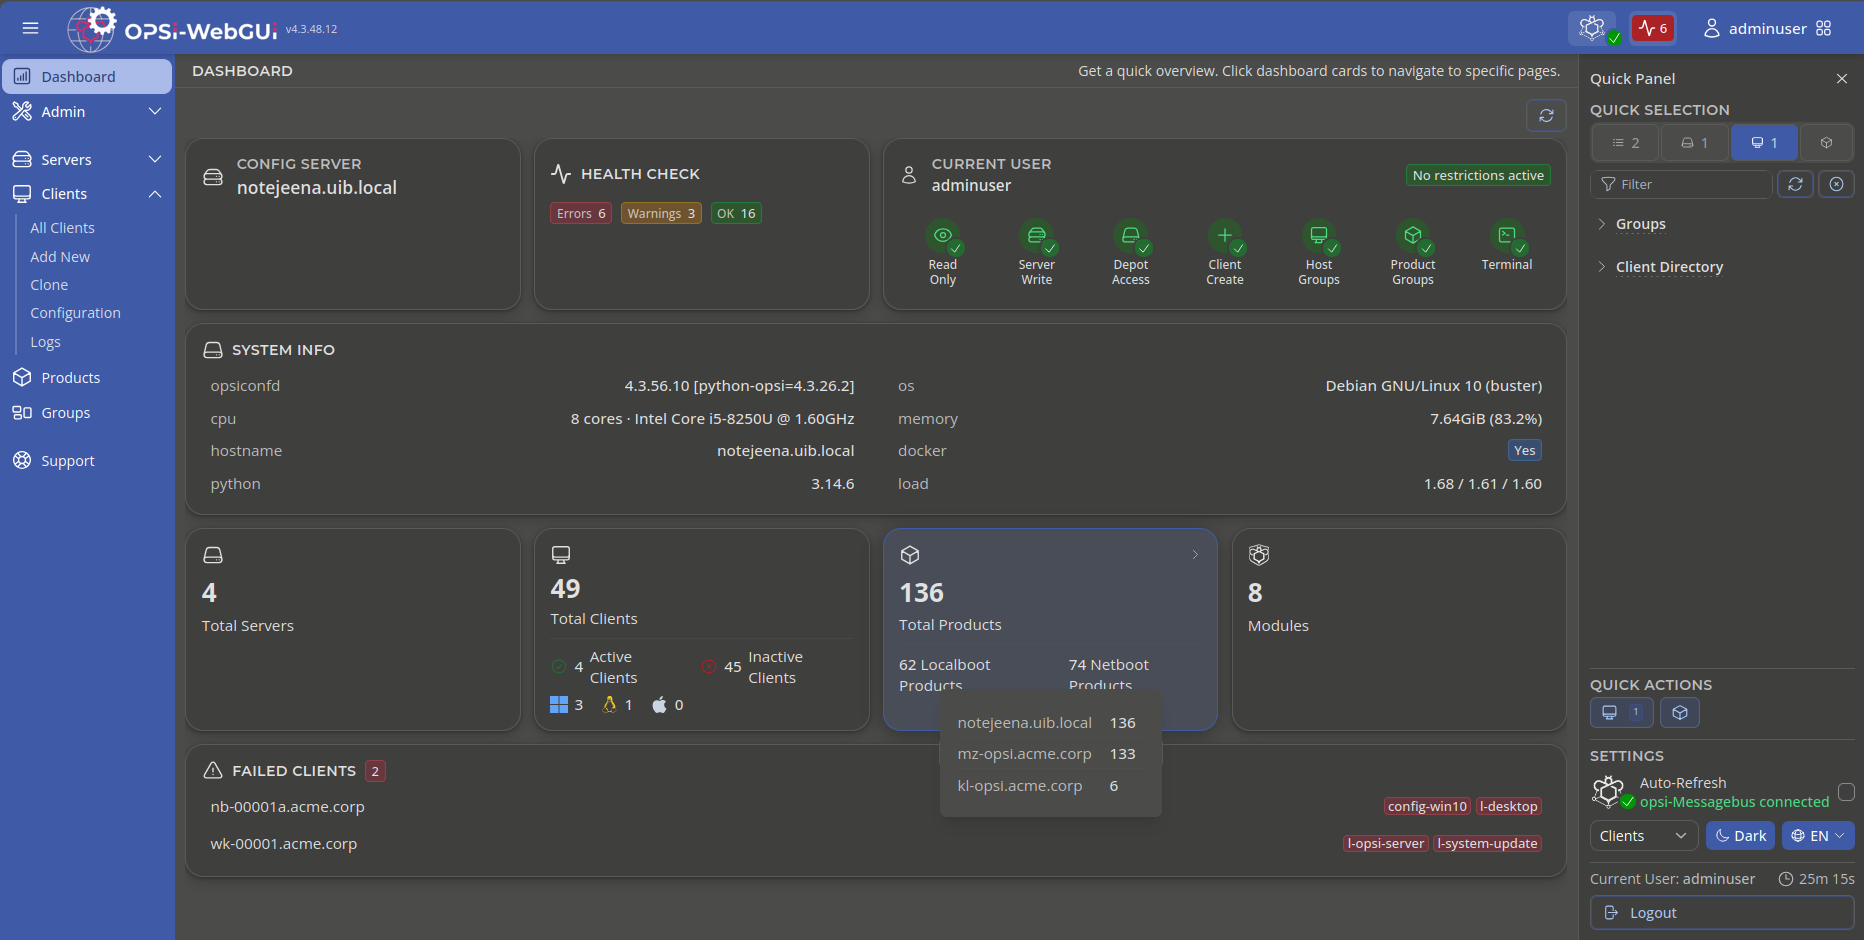
The new dashboard gives you an immediate overview of your OPSI environment, including health check statistics, active user restrictions, system information, and statistics for servers, clients, products, and modules. It also provides an overview of failed clients. Most cards are clickable and take you directly to the corresponding page, while tooltips provide additional information where needed.
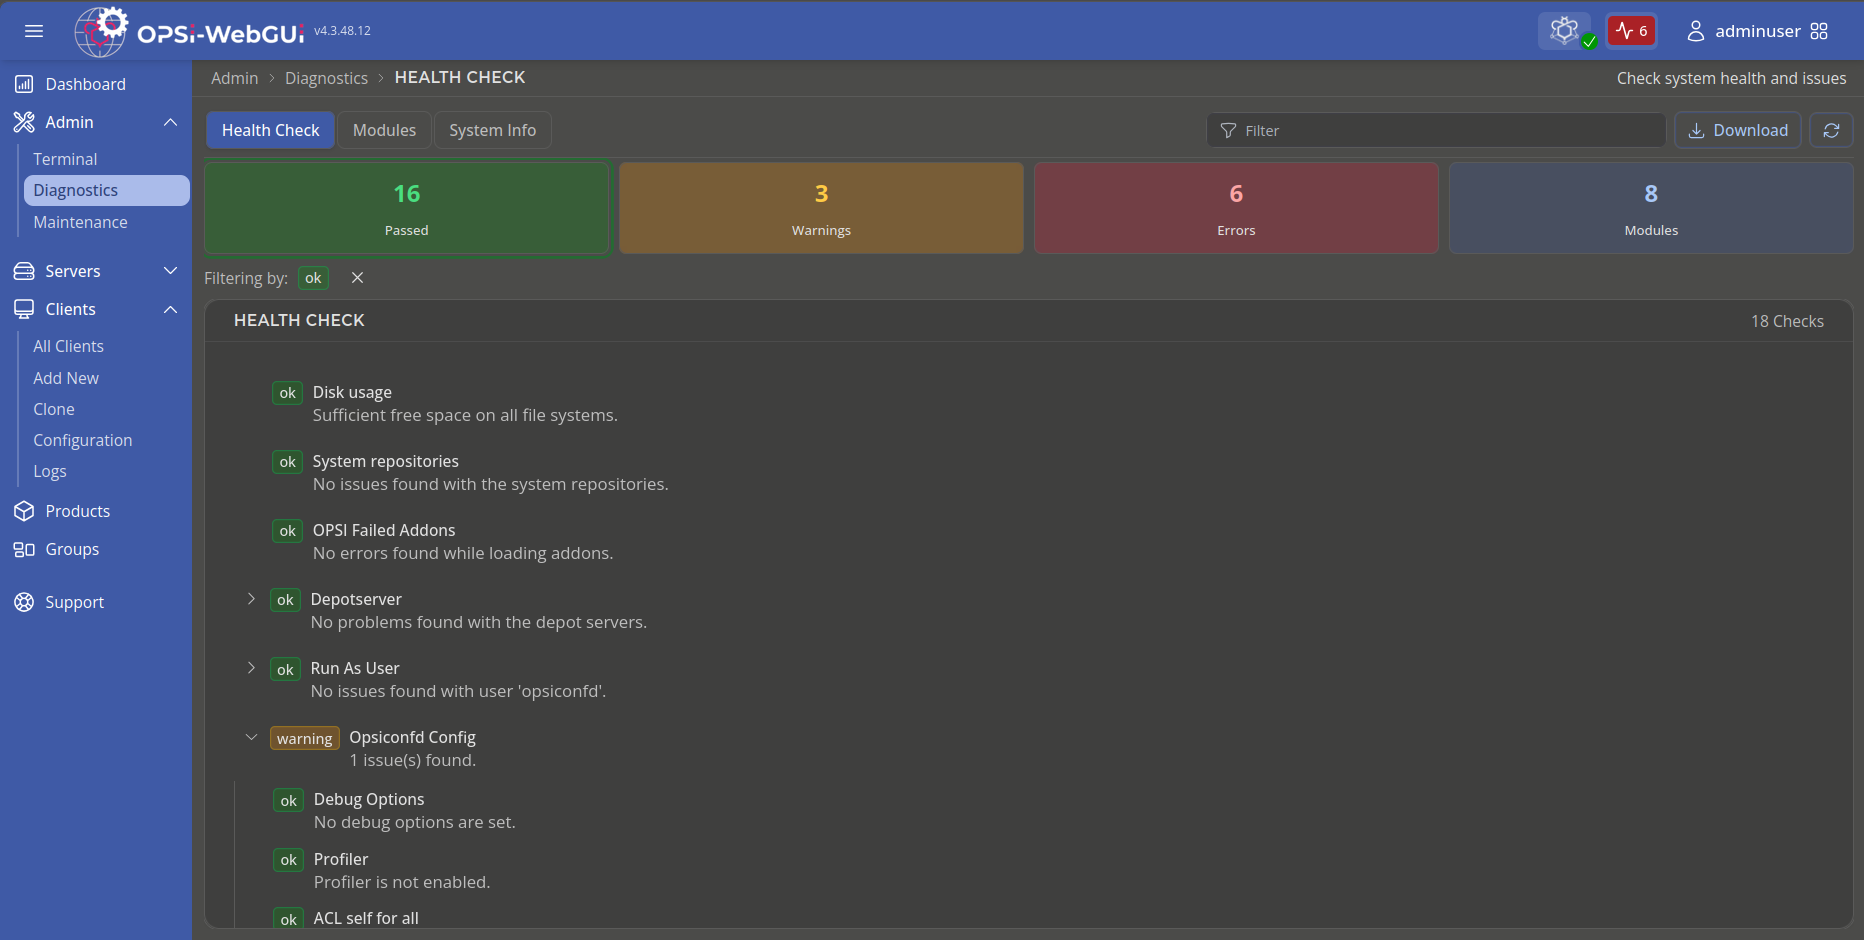
The top bar also shows the current Health Check status and links directly to the Health Check page. For deeper troubleshooting, Admin > Diagnostics provides access to Health Check, Modules, and System Info, with quick filters.
Live updates with OPSI-Messagebus
OPSI-WebGUI uses the OPSI-Messagebus to receive real-time updates. The Auto Refresh setting in the Quick Panel lets you enable or disable automatic updates and shows the current connection status.
When Auto Refresh is enabled, relevant changes are updated automatically. When it is disabled, a Changes detected button appears so you can refresh the data manually. The Messagebus connection status is also shown in the top bar.
Tables built for large environments
OPSI-WebGUI tables are designed for efficient administration, even in large environments. They support infinite scrolling or pagination, single or multiple selection, and resizable panels that adapt to smaller screens.
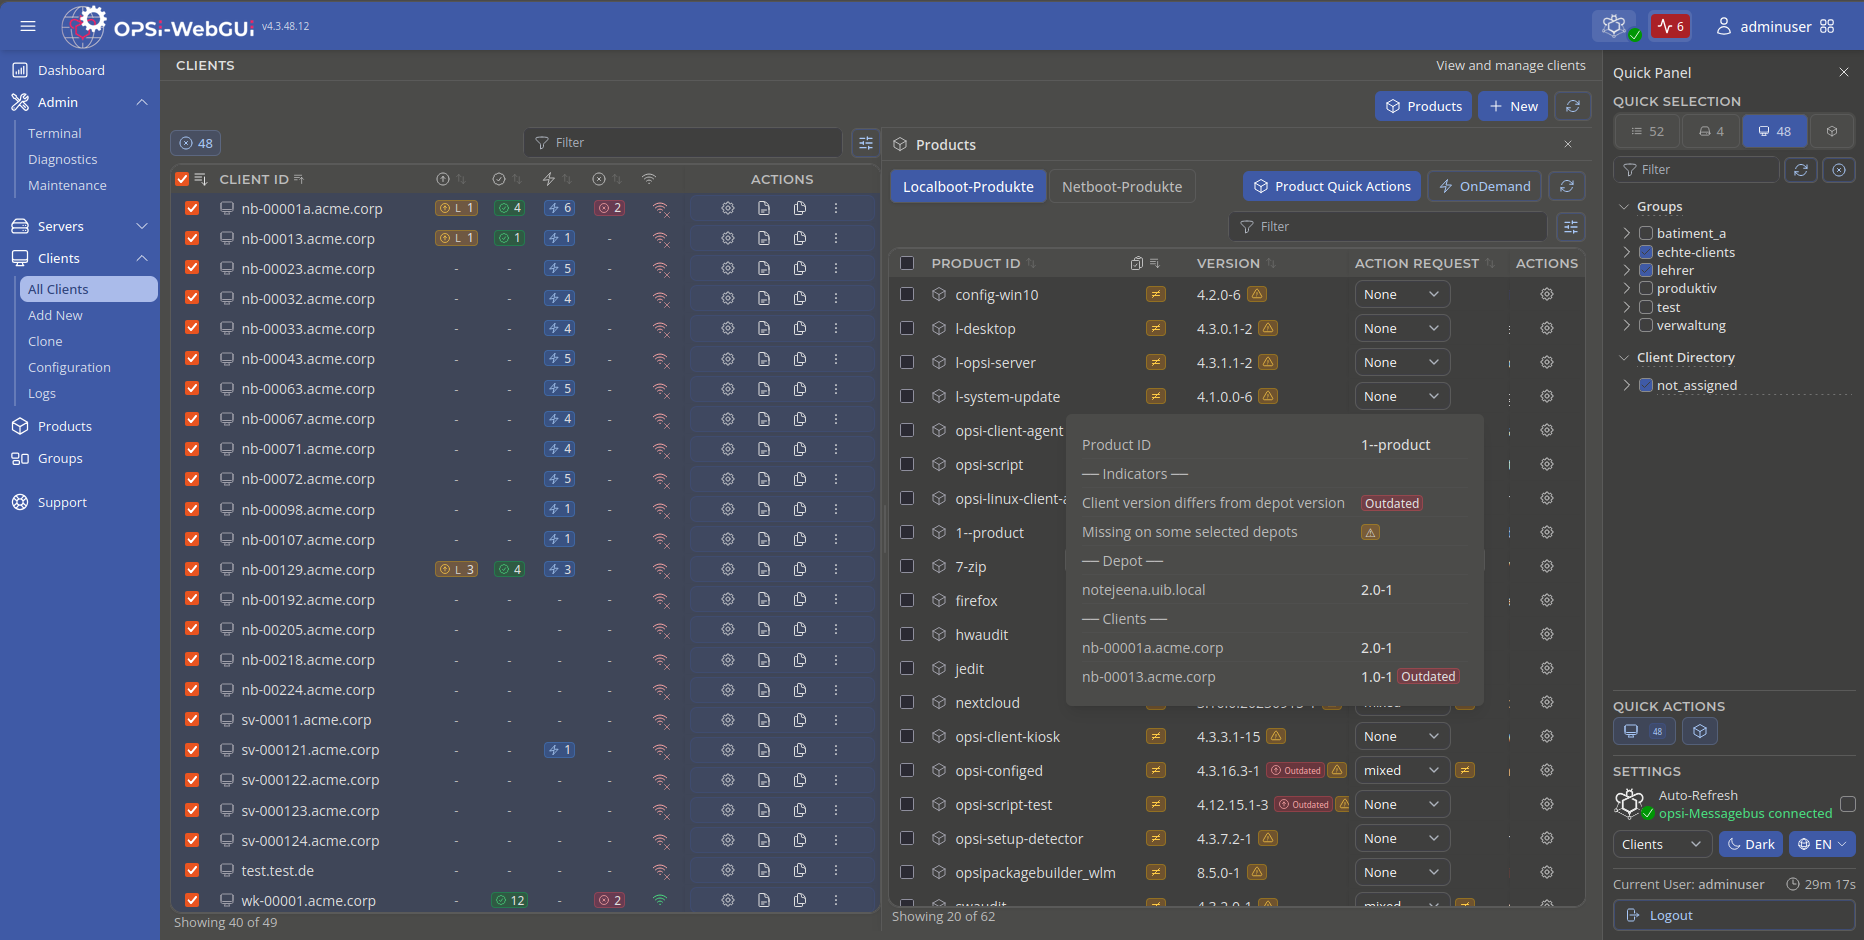
Filters and table settings are remembered, while status badges and tooltips provide additional information at a glance. Most table elements link directly to the relevant details. For example, the Clients > Products view displays clients and their products side by side, making product management easier. Clicking a status badge opens the same view with the matching products already filtered.
Groups with Lazy Loading
The redesigned Groups page makes it easier to manage groups.
You can assign members when creating a group, search for and select multiple members, and work efficiently with large group hierarchies through lazy loading.
Tooltips provide additional information about group assignments and special cases such as not_assigned.
Product icons from your own packages
OPSI-WebGUI can display product icons directly in the Products table.
Product maintainers can add an icon to the product package and reference it in opsi-meta-data.toml.
[product]
productIconFilePath = "product.png"
The icon is then read from the depot and displayed automatically, with no additional WebGUI configuration required.
Safer change handling
Changes to configuration, product properties, and action requests are first kept locally in the browser instead of being immediately sent to the server.
The Unsaved Changes button shows pending changes and lets you review, save, or discard them. Modified values are also clearly marked in forms and tables.
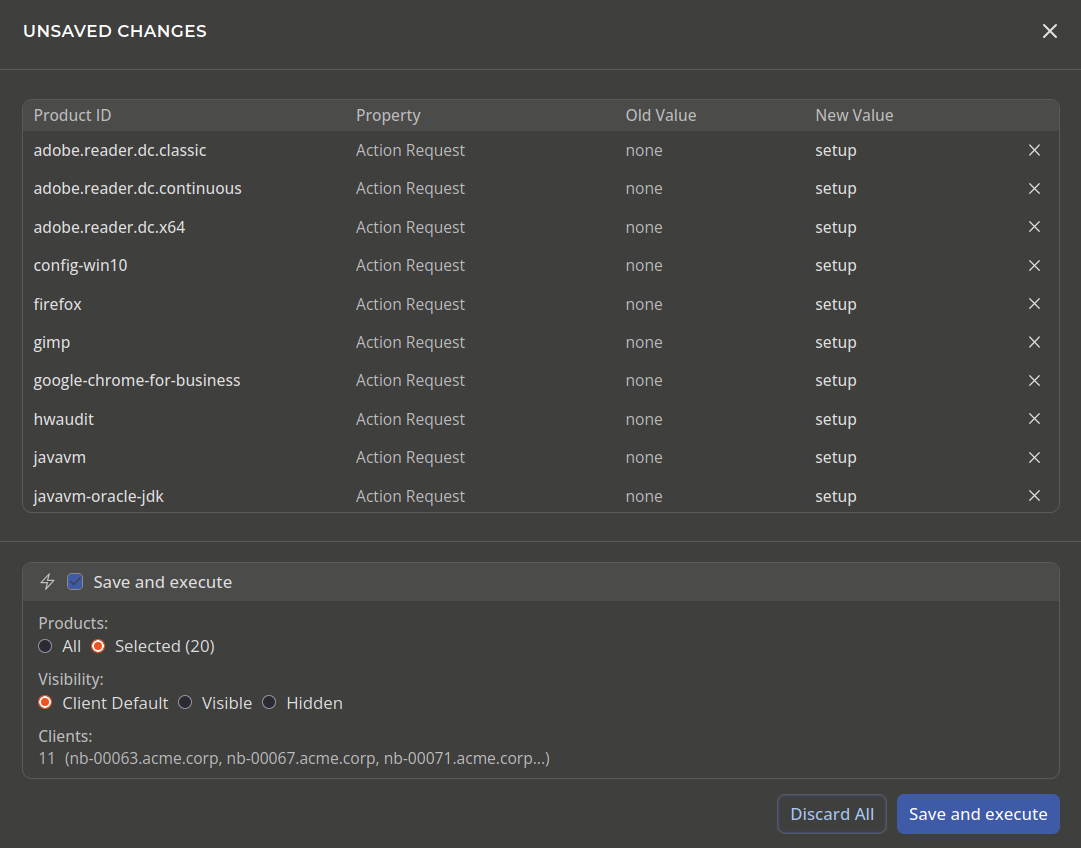
Saving does not mean executing. Saving writes the change to the OPSI server. It does not necessarily execute an action on a client. You can use Save and execute in the Unsaved Changes dialog or On Demand from the Products page, Quick Panel, or Clients table.
If you try to leave a page with unsaved changes, OPSI-WebGUI warns you before navigating away.
Other improvements
Alongside the larger changes, OPSI-WebGUI 4.3.48 includes many smaller improvements throughout the interface, including:
- Direct links: Quickly open related information, such as logs or configuration for a selected client.
- Default Page: In the Quick Panel settings, you can choose your preferred start page after login, such as Dashboard, Clients, or Products.
- Client logs: Use the Log Marker to jump directly to a specific line in the loaded log output and continue your analysis from there.
- Keyboard-friendly selection: Select multiple items using familiar keyboard shortcuts such as Ctrl+A and Shift for range selection.
- Clearer feedback: Improved alerts, status indicators, help tooltips, and visibility of user restrictions make the interface easier to understand.
- Resizable panels: All panels in the interface can be resized, giving you more flexibility to adjust the layout and make better use of your screen space.
Accessibility, security, performance, and quality
The 4.3.48 release also includes improvements beyond the visible interface.
- Accessibility: Includes better keyboard navigation, screen reader support, WCAG-oriented validation, and clearer visual indicators that do not rely on color alone, improving usability for users with different accessibility needs.
- Security: Includes SQL injection fixes and security regression tests. Every addon build includes a CycloneDX SBOM. Dependency vulnerabilities are checked, and unapproved install scripts are blocked.
- Performance: Large data sets have been optimized, with lazy loading where appropriate and stress testing for large environments..
- Quality: OPSI-WebGUI is tested with real OPSI environments to identify problems before they reach users. Regular and nightly test runs help maintain stability as development continues.
For the complete list of changes, see the What’s New card on the Support page in OPSI-WebGUI.
Give OPSI-WebGUI a try
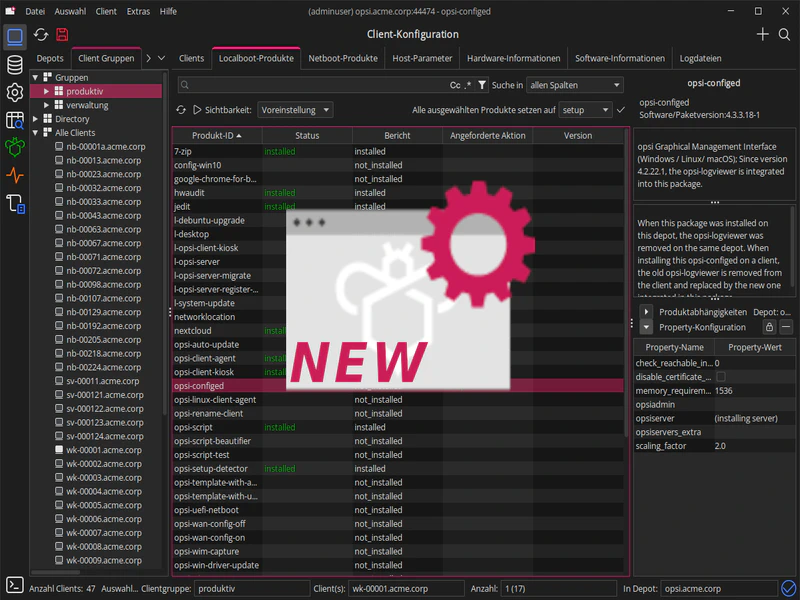
If you currently use the opsi-configed, you can continue using it alongside OPSI-WebGUI.
Both use the same opsiconfd, permissions, and OPSI data, so changes made in one interface are immediately available in the other.
OPSI-WebGUI covers the main administration workflows and offers the benefits of a browser-based interface, including no workstation installation, access from different devices, responsive layouts, and shareable URLs.
Some features are still only available in the opsi-configed, so both interfaces can complement each other while OPSI-WebGUI continues to evolve.
The OPSI-WebGUI workflow
Let’s take a quick look at the typical workflow in OPSI-WebGUI.
1. Select your scope
OPSI-WebGUI uses a shared global selection for the servers, clients, and products you are working with. You can make this selection in the Quick Panel, where the Quick Selection area also allows you to select servers, client groups, and product groups. You can also select servers, clients, and products directly from their main tables.
The Groups page is used to create and manage groups; group selection itself is done through the Quick Panel. Your global selection remains active when moving between pages and survives reloads and logouts.
Detail panels, available through the Action column in the tables, let you view or edit an item without leaving the current page while keeping it part of the global selection. In contrast, some standalone pages, such as Clients / Configuration and Servers / Configuration, use a local selector. This lets you work with a specific client or server without changing your global selection.
2. Your selection determines the Products view
The Products page changes based on your selection. Without selected clients, it shows products from the selected servers and their depot defaults. With selected clients, it shows information related to those clients, such as installation status, and action requests.
You can also manage products from the Clients table using the Products button, which shows clients and their products side by side. Status badges can be clicked to filter the product view.
3. Make changes, save, and execute
Make your configuration, product property, or action-request changes and review them in Unsaved Changes before saving them to the server. After saving, use On Demand to execute actions on selected clients.
For quick tasks, the Quick Panel provides Client Quick Actions such as On Demand, notifications, reboot, shutdown, and client-agent deployment. Product Quick Actions help you find products by conditions such as installation status or outdated versions and apply action requests to selected clients or servers.
4. Monitor and maintain your environment
The Dashboard provides an overview of your OPSI environment. The top bar shows the Health Check, OPSI-Messagebus, and session status, while Auto Refresh provides live updates.
The Admin section provides tools for diagnostics and maintenance, including Health Check, Modules, System Info, server terminal access, and maintenance functions.
Open source and community feedback
OPSI-WebGUI is open source, and contributions are welcome. You can help by reporting bugs, improving the documentation, adding translations, or contributing code.
Contribute on GitHubWe would love to hear your feedback and ideas for improving OPSI-WebGUI. Tell us which opsi-configed workflows you miss and what features or improvements you would like to see in the future. Please share your ideas and feedback in the OPSI forum.
For more information about using OPSI-WebGUI, see the OPSI-WebGUI User Guide.